What is the impact of the COVID bump on the industry subscriber base?
Readers First | 11 May 2020
Good morning! This is Readers First, a newsletter for INMA members on reader revenue. I’m researcher-in-residence at INMA. E-mail me at: grzegorz.piechota@inma.org
Was this e-mail forwarded to you? Sign up to this newsletter.
|
1. UPDATE: Bump in online subscriptions continues
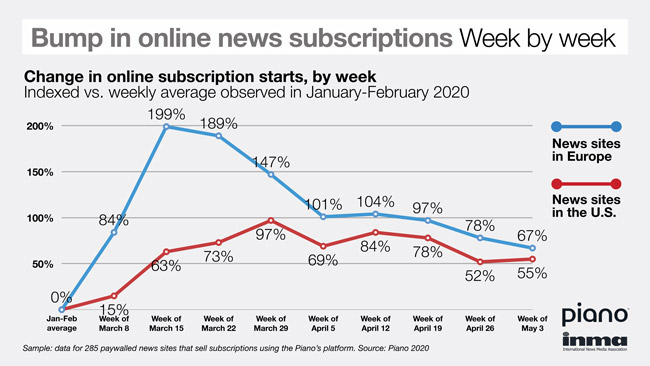
Last week, European news sites were adding new subscribers at a rate 67% up compared to the pre-pandemic period, and the U.S. sites were selling at a rate 55% up, reported Piano.

For more than two months, Piano has shared with INMA the benchmarks based on the data of 285 paywalled news sites that sell subscriptions using their technology.
Piano’s weekly chart has become a news industry’s must-see. INMA members, such as Anna Marie Menezes of The Toronto Star and Mark Campbell of Tribune Publishing say they have been using it to benchmark their own performance.
Patrick Appel, director of research at Piano, promised to analyse the churn rates of the newly acquired subscribers, and we hope to release the first analyses in the coming weeks.
2. COVID BUMP: What is the impact on the publishers’ business?
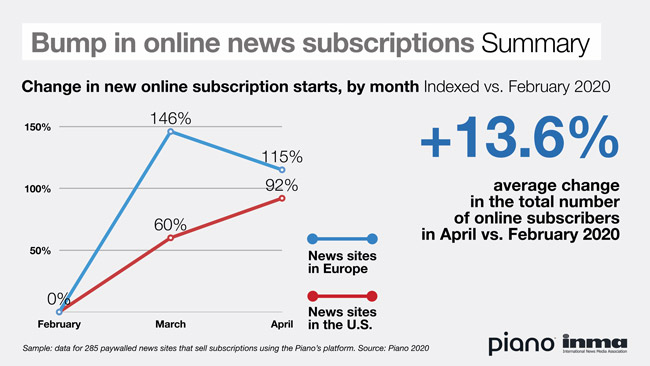
By April, news publishers gained on average 13.6% subscribers versus February 2020. This is the first Piano benchmark on the impact of the bump on the subscriber base of news publishers in Europe and in the United States.
Piano summed up the gains from March and April and offered monthly benchmarks exclusively for the INMA Virtual World Congress, which continues through the rest of May.

- In Europe, news sites saw monthly new subscription starts increase 146% in March and 115% in April compared to February.
- In the United States, publishers saw monthly starts go up 60% in March and 92% in April.
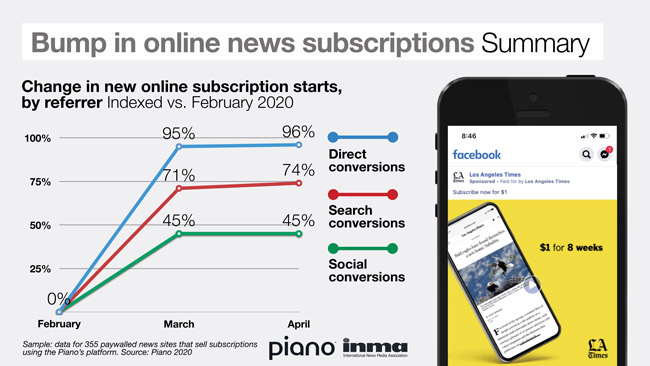
Interestingly, conversions of the direct visitors were up at a higher rate than those of visitors referred by search and social. This is based on a slightly larger data set of 355 paywalled news sites that use Piano to sell subscriptions:

- Direct conversions were up 95% in March and up 96% in April vs. February.
- Search conversions were up 71% in March and up 74% in April.
- Social conversions were up 45% in March and in April.
This matters because, even before the pandemic per the Piano’s 2019 data, direct visitors converted at a double rate of search visitors (38% of all conversions are direct and 22% come from Google) and eight-fold the rate of social visitors (4.5% conversions come from Facebook).
Perhaps the data on subscription referrers confirm observations by individual publishers that:
- New subscriptions starts during the COVID lockdown have not come primarily from new visitors (who are more likely to visit via search or social).
- But from the returning visitors who mobilised to come frequently during a high-interest event (and these people are more likely to visit directly).

Another surprising observation: Visitors were buying monthly plans more often in March than in February, but then in April the share of annual plans among all subscriptions has increased. This is perhaps linked to the success of different types of promotional offers that many publishers launched to sign up more subscribers during the pandemic.
3. CASE STUDY: Anatomy of a traffic bump to Der Spiegel in Germany
During the recent spike in demand for news in Germany, Der Spiegel has successfully mobilised its low- and medium-engaged readers to visit even more frequently. It may though wish to improve ways it is attracting new visitors.
These are the top-line insights based on the analysis of three months of traffic data to Spiegel.de, the site of a famous German news magazine Der Spiegel.
- My exchange with Alexander Held of Spiegel’s research team started with his interest in another study reported in this newsletter: Based on the data collected by Deep.BI, we analysed reader flows between engagement segments at a mid-sized European news site.
- Alexander’s team is new and aims at assisting Der Spiegel with a holistic picture of reader behaviours and needs. Experts on qualitative and quantitative research are sitting next to data analysts and A/B testers. As an integrated team, members accompany the product and editorial development, as well as support sales in market development.
- Der Spiegel is in the process of setting up infrastructure that will allow it to segment visitors based on engagement measured by RFV scoring, similarly to the Deep.BI’s case, and to measure flows between segments. As of now, the team uses a simplified segmentation by frequency of visits in a month. Still, it offers valuable insights.

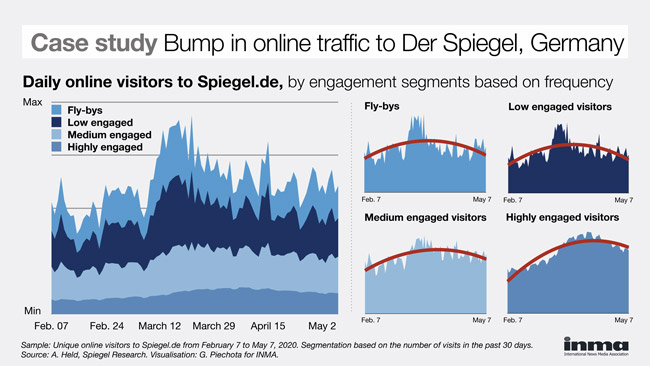
Here’re daily online visitors to Spiegel.de segmented by frequency:
- Fly-bys are visitors with one visit in the past 30 days.
- Low-engaged visitors made two to 10 visits in the same period.
- Medium-engaged visitors visited 11 to 50 times.
- Those highly engaged visited more than 50 times.
These charts clearly show a shift towards a more highly engaged visitor base. As Alexander Held explained: “We were able to keep a lot of highly engaged visitors with us after the coronavirus bump, as this is the only segment which does not decline much after the peak.”
What else can we see in the charts?
- Although it’s hard to be sure without analysing the flows between segments, in my opinion, the spike in the medium and higher engaged segments is likely caused by a mobilisation of readers who were low and medium engaged before.
- This is good news, as that means Der Spiegel delivered a good service to its readers during the pandemic and the engaged readers are more likely to subscribe.
- What could be the matter of concern is a sharp decrease in the number of fly-bys and low engaged segments just after the peak. This suggests that Der Spiegel might wish to review its efforts to attract new traffic to the Web site.
- The review could include metrics used by the newsroom and online marketing teams to reach new online visitors, a content distribution strategy using search, social and other sites, and a paid marketing strategy.
4. MARKETING: Taxonomy of Facebook ads by top news subscription sites
In the past month, 50 out 56 top news sites by the number of online subscribers advertised on Facebook. Here is what they used ads for.
I released the first results of this study last week: 65% of the 4,625 ads that I retrieved from the Facebook’s Ad Library promoted the use of news products, while 24% advertised the subscription offers. The rest, or 11%, expanded reach of the publishers’ branded content campaigns on behalf of the third parties.
Here’s the detailed breakdown and the share of each category in the total number of ads observed in the study:

- Among the ads that promoted the use of news products, the largest number linked directly to individual articles (40% of the total number of ads), promoted mobile apps (15%), videos or podcasts (2%), and editorial features such as newsletters (2%).
- Among the ads that promoted the subscription offers, the largest number promoted offers to new online subscribers (23% of the total number of ads), including price discounts or trials (14%), editorial benefits (6%), brand values or journalistic mission (2%).
Here are some standing-out examples of the first category, the ads that promoted reading or adoption of the features:

In the feedback after the last week’s newsletter, some INMA members, such as Karl Wells of The Wall Street Journal, pointed out limitations of my methodology and the sample used. This was so helpful to clarify that:
- My study included ads from the main profiles of the news brands only, while many brands have multiple profiles on Facebook and Instagram – for sections or editions. Although the ads often are concentrated on the main and the most liked profiles, I might have reported fewer ads than the publishers bought.
- My study also included ads from the core geographical markets only, for example the United States or France, while some brands market internationally. For example, according to my study, The Wall Street Journal run 845 ads. In fact, per Karl’s e-mail, it run a total of 2,400 ads.
- My source of ads, the Facebook’s Ad Library, featured campaigns with multiple versions of one ad and individual ads that might have been a part of the same campaign. Therefore, I was told, it would be better to refer to “ads” rather than “campaigns.” For example, the WSJ run the largest number of ads in my sample, but many of the ads were actually just versions of the same concept refreshed to keep the campaigns efficient and relevant. In total, the Journal had in the studied period 50 campaigns across the funnel — from acquisition to brand marketing, to churn prevention.
- My study provided a snapshot of the publishers’ activities in April. But without data on previous months, one should not draw any conclusions about whether these brands have changed anything in their advertising strategy during the pandemic. For example, in case of the Journal, there was no change.
About this newsletter
Today’s newsletter is written by Grzegorz (Greg) Piechota, Researcher-In-Residence at INMA, based in Oxford, England. Here I share results of my original research, notes from interviews with news publishers, reflections on my readings. Previous editions are archived online.
This newsletter is a public face of a revenue and media subscriptions initiative by INMA, outlined here. E-mail me at grzegorz.piechota@inma.org with thoughts, suggestions, and questions. Sign up to our Slack channel.
|


